Visualizing Monthly Appointment Distribution#
Displays the percentage of appointments per month across the entire dataset, allowing quick identification of seasonal peaks or gaps in activity. This visualization provides a high-level overview of the annual distribution of outpatient appointments.
Function Overview#
Function: medscheduler.utils.plotting.plot_monthly_appointment_distribution(df)
Inputs:
df (pd.DataFrame)— Appointments table containing anappointment_datecolumn (datetime-like or convertible).
Returns: matplotlib.axes.Axes — Bar chart showing the monthly percentage of total appointments.
Validation & error handling:
Missing
appointment_datecolumn → raisesValueError("DataFrame must contain an 'appointment_date' column.").Non-datetime values in
appointment_dateare automatically coerced usingpd.to_datetime(errors='coerce').
Output Description#
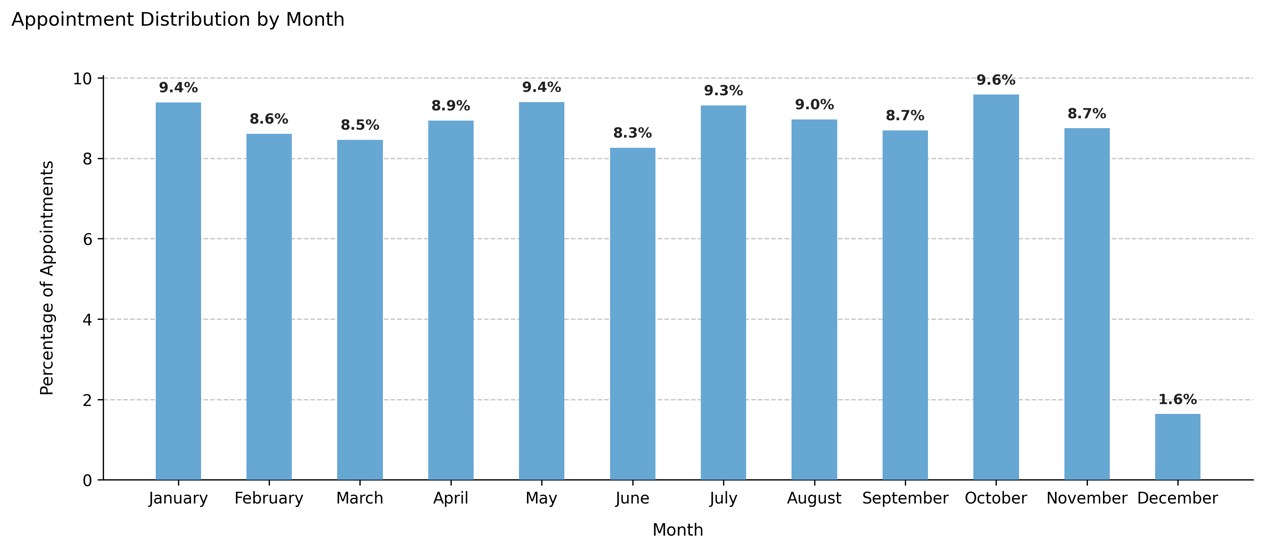
X-axis: Calendar months (January–December).
Y-axis: Percentage of total appointments in each month.
Bars: Represent normalized frequencies of appointments (0–100%).
Color scheme: Primary Medscheduler blue (
#67A7D4).Annotations: Each bar displays its corresponding percentage value above the bar.
Style: Minimalist PyData-style figure with dashed Y-grid and left-aligned title.
This plot helps verify whether the generated dataset reflects realistic or intentionally weighted seasonal patterns (e.g., reduced activity in summer months or end-of-year peaks).
Example#
from medscheduler import AppointmentScheduler
from medscheduler.utils.plotting import plot_monthly_appointment_distribution

# Generate synthetic appointments
sched = AppointmentScheduler()
slots_df, appts_df, patients_df = sched.generate()

# Visualize monthly distribution of appointment activity
ax = plot_monthly_appointment_distribution(appts_df)
ax.figure.show()  # optional when running interactively
Output preview:
The bar chart below displays the monthly distribution of appointment activity across the simulated period, expressed as the percentage of total appointments per month.
Next Steps#
Compare monthly vs. weekday trends: Visualizing Appointment Distribution by Weekday
Explore seasonal weighting factors: Seasonality and weights
Learn how appointment timing is generated: Appointment timing
Adjust generation parameters via customization options: Customization options